
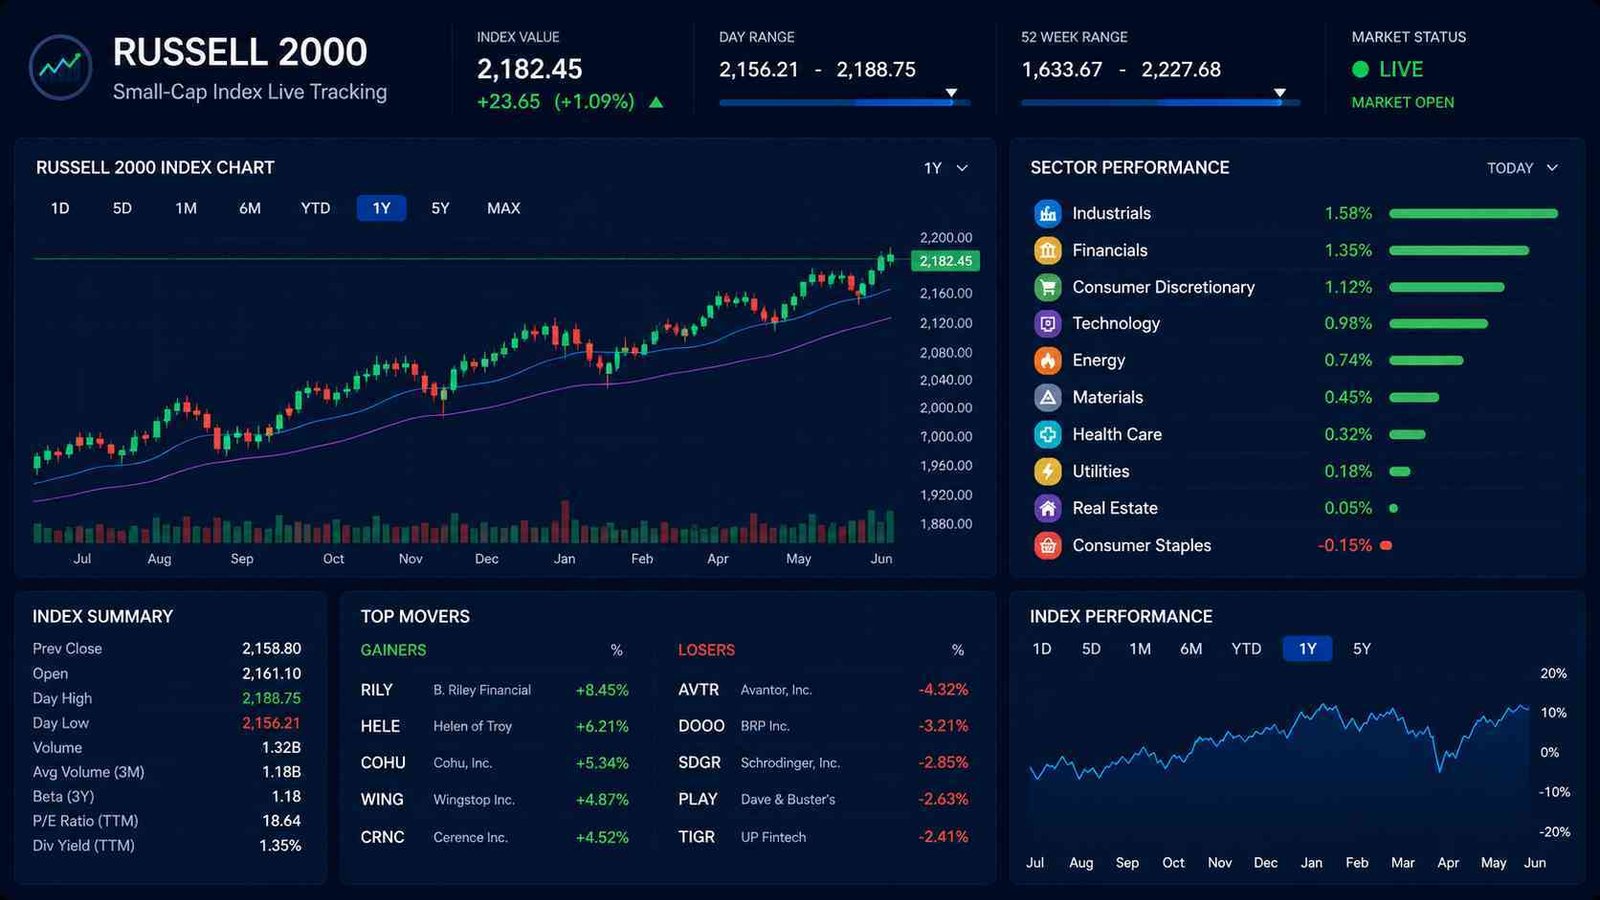

For most of the past several years, small-cap stocks were the market’s forgotten segment. The Magnificent Seven dominated headlines. Mega-cap AI names absorbed the majority of institutional capital. The Russell 2000 lagged, underperformed, and rarely made the front page.
The first half of 2026 changed that completely.
The Russell 2000 gained 22% through June 30, 2026, its best first-half performance since 1991. It outpaced the S&P 500’s 9.6% gain and the Nasdaq’s 13% advance by a margin that would have looked improbable even six months earlier. All 11 sectors within the index finished positive. The index hit a fresh all-time high of 3,033.75 in late June. The rally was broad, sustained, and Wall Street is still debating how much further it can run.
Understanding what the Russell 2000 actually is, what drove that performance, and what risks could reverse it is no longer a niche exercise. It is increasingly central to how informed investors think about US equities.
FintechZoom.com is one of the platforms investors use to monitor the Russell 2000 in real time, tracking live index data, sector performance, and market news alongside tools built for active analysis. For a deeper look at the platform itself, that is covered separately. This guide focuses entirely on the Russell 2000.
Table of Contents
What Is the Russell 2000 and How Does It Work?
The Frank Russell Company launched the index in 1984 to fill a gap that no major benchmark was addressing. While the S&P 500 and Dow Jones tracked large, established companies, the smaller businesses driving employment and innovation across America had no widely accepted benchmark of their own. FTSE Russell, now a subsidiary of the London Stock Exchange Group, maintains the index today.
The construction is rules-based. FTSE Russell ranks every eligible US-listed stock by market capitalization, takes the top 3,000 to form the Russell 3000, then splits that list. The top 1,000 become the Russell 1000. The bottom 2,000 become the Russell 2000. No committee decides who belongs. No subjective judgment is applied. Eligibility requires a major US exchange listing and minimum market cap and float thresholds, nothing more.
One thing that catches investors off guard: there is no profitability screen. A company can lose money consistently and still be included as long as it meets the size criteria. Roughly 40% of Russell 2000 constituents were unprofitable as of 2026. That is not a design flaw. It reflects the actual character of the small-cap universe, which leans heavily toward early-stage growth companies still investing ahead of earnings.
How the Index Is Weighted
Unlike the Dow Jones, which weights by share price, the Russell 2000 uses float-adjusted market capitalization weighting. Only shares available for public trading are counted, excluding insider and institutional locked-up shares. Larger companies within the index carry more daily influence than smaller ones. A 5% move in one of the top holdings shifts the index more visibly than the same move in a company near the bottom of the roster.
The 2026 Reconstitution: A Historic Change
In 2026, FTSE Russell made a structural change that had not happened in the index’s 40-year history. Reconstitution shifted from annual to semi-annual, meaning the index is now rebuilt in both June and December rather than only in June. The goal is to keep membership more current. Companies that cross size thresholds now reach their correct index classification twice as fast.
The June 2026 reconstitution also showed how much the broader market had grown. The Russell 3000’s total market capitalization rose 29% to $75.6 trillion. The small-cap threshold separating the Russell 1000 and Russell 2000 jumped from $4.6 billion to $5.7 billion. The Russell 2000’s own total market cap grew from $2.7 trillion to $3.5 trillion. The entire small-cap segment moved up.
Why Small-Cap Stocks Behave Differently
Approximately 80% of Russell 2000 company revenues come from domestic US sources. S&P 500 companies generate substantial international revenue and face foreign exchange risk, global trade exposure, and geopolitical variables that have no bearing on a regional bank in Ohio or a domestic manufacturer in Texas. The Russell 2000 is a much purer read of US economic conditions than any large-cap index.
That domestic focus cuts both ways. When the US economy is healthy, small caps tend to reflect it first and most directly. When conditions tighten, they feel it faster too. Smaller companies typically carry more floating-rate debt than large-cap peers, roughly 40% of Russell 2000 debt is floating-rate compared to under 10% for S&P 500 companies. When rates rise, their borrowing costs increase almost immediately. Bank of America has estimated that every additional 25 basis point rate hike reduces Russell 2000 operating earnings by approximately 2%, a sensitivity that has no equivalent among large-cap indices.
The profitability gap also creates volatility the broader indices do not have. Companies that survived on near-zero rate financing face a fundamentally different environment when rates normalize. That is why the index historically experiences drawdowns 30% to 40% deeper than the S&P 500 during corrections, and why understanding what drives it is not optional for anyone using it as a portfolio building block.
What Actually Drives the Russell 2000
Federal Reserve Policy
Three consecutive 0.25% Fed rate cuts in late 2025 brought the federal funds rate to 3.50% to 3.75%. For large-cap companies with fixed-rate debt and strong cash flows, those cuts were a footnote. For Russell 2000 companies carrying floating-rate debt, the impact was immediate. Lower interest costs flowed directly into balance sheets, expanding margins that had been compressed for years during the high-rate environment of 2023 and 2024.
That rate relief set the foundation for the 22% first-half gain in 2026. The reverse risk is equally direct. When Fed Chair Kevin Warsh signaled a hawkish tone at his first press conference in June 2026, small-cap stocks felt the pressure before large caps did. The Russell 2000’s sensitivity to Fed direction is not a coincidence. It is structural.
The Great Rotation: When Capital Leaves Mega-Caps
At the start of 2026, the Russell 2000 was trading at approximately 18x forward earnings. The S&P 500 was near 26x. That 30% valuation discount had reached a 25-year extreme. Value-oriented institutional investors who had been crowded into expensive mega-cap technology names began rotating into small caps where the same economic growth story could be bought at a fraction of the valuation.
The rotation showed up in performance. The Russell 2000 outperformed the Nasdaq for 14 consecutive sessions in January 2026, the longest such streak in over three decades. Sectors that had been ignored for years, regional banks, domestic industrials, biotech, energy suppliers, attracted fresh capital as the market broadened beyond the Magnificent Seven.
Earnings Growth and Sector Momentum
Consensus forecasts for Russell 2000 earnings growth climbed to 38% for 2026 from approximately 23% at the start of the year, according to LPL Financial. Bottom-up analyst estimates pointed to 43% year-over-year earnings growth over the next 12 months, a figure that meaningfully outpaces projections for the S&P 500.
Chip-related companies were the biggest individual winners. Semiconductor and semiconductor equipment businesses account for 16 of the Russell 2000’s 50 best-performing stocks through the first half of 2026. Companies like Aehr Test Systems, Ichor Holdings, and MaxLinear each rallied more than 400%, demonstrating that the AI investment boom had spread well beyond the large-cap names dominating most AI coverage.
How to Read and Track Russell 2000 Data on FintechZoom.com
Raw index numbers tell investors very little on their own. What matters is the context behind each move: what percentage the index moved, on what volume, and which sectors drove it.
A 2% decline on heavy volume following a hawkish Fed statement carries different information than a 2% decline on thin pre-holiday volume. Sector performance within the index tells the most specific story. If financials and industrials are leading gains while technology lags, the market is signaling something different than when semiconductors are driving the move alone.
Technical Indicators That Matter Most for Small-Caps
The 200-day moving average is as relevant for the Russell 2000 as for any major index. When the index trades above it, the long-term trend is broadly constructive. When it breaks below, institutional investors reduce risk. The 50-day moving average serves the same function over a shorter timeframe.
RSI is particularly useful for the Russell 2000 because small-cap momentum tends to stretch further in both directions before reversing. An RSI above 70 after an extended rally warrants attention. Below 30 during a correction has historically presented re-entry opportunities for patient investors. MACD helps identify momentum shifts, and Bollinger Bands flag when the index has moved too far from its average in either direction, both signals that carry more weight in a high-volatility index than in steadier large-cap benchmarks.
FintechZoom.com consolidates live Russell 2000 data, sector breakdowns, technical chart tools, and real-time market news in one place. Custom alerts let investors define price levels, volume thresholds, or news triggers rather than monitoring screens manually. For an index covering 2,000 companies across every sector of the US economy, that kind of consolidated dashboard reduces the information gap that small-cap investors have historically faced against institutional counterparts.
Russell 2000 vs S&P 500: What the Gap Tells Investors
These two indices are not competing versions of the same thing. They measure entirely different segments of the market, and the relationship between them carries as much information as either index alone.
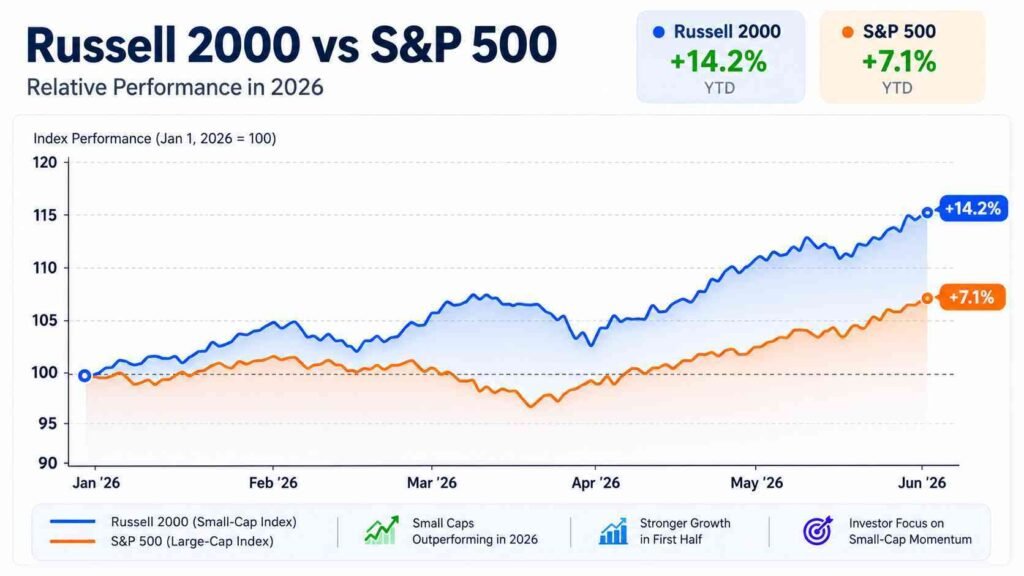
The S&P 500 tracks 500 large-cap companies weighted by market capitalization. The Russell 2000 tracks 2,000 small-cap companies weighted by float-adjusted market cap. S&P 500 companies generate significant international revenue. Russell 2000 companies are predominantly domestic. S&P 500 constituents require no profitability screen but skew heavily toward profitable, cash-generating businesses. Russell 2000 constituents include roughly 40% unprofitable companies.
When the Russell 2000 outperforms the S&P 500 over an extended period, it typically signals improving domestic economic conditions, a rotation away from expensive large-cap valuations, or both. When the S&P 500 leads, mega-cap concentration and international revenue tailwinds are driving returns that smaller domestic businesses cannot replicate. In the first half of 2026, Russell 2000’s outperformance over the S&P 500 by more than 12 percentage points was the widest gap for a first half since 2001. That gap communicated something specific about where the market saw value and which segment of the economy investors were willing to pay up for.
How to Invest in the Russell 2000
The index itself is not directly investable. Exposure comes through funds and instruments that track it.
IWM vs VTWO: Which ETF Makes More Sense
The iShares Russell 2000 ETF, ticker IWM, is the most liquid Russell 2000 tracking fund available. It trades millions of shares daily with tight bid-ask spreads, making it the standard choice for active traders who need to enter and exit positions quickly. Its active options market also makes it the primary vehicle for investors using derivatives for hedging or tactical exposure.
The Vanguard Russell 2000 ETF, ticker VTWO, carries a significantly lower expense ratio than IWM. For long-term passive investors who do not need the liquidity and options infrastructure that IWM provides, VTWO is the more cost-efficient choice. For current fee information on both funds, check the official fund pages directly as expense ratios change over time.
Futures and Options
E-mini Russell 2000 futures trade on the Chicago Mercantile Exchange under the ticker RTY. Each contract moves $50 per full index point, creating significant leverage at current index levels. Options on IWM provide defined-risk exposure for investors who want to hedge existing small-cap positions or express directional views without full capital commitment. Both instruments require a working understanding of leverage and options mechanics before use.
How Much Small-Cap Exposure Is Enough
Most financial professionals suggest small-cap allocations of 10% to 20% of an equity portfolio for investors who can tolerate higher volatility in exchange for higher long-term growth potential. Historical data shows small caps have delivered higher returns than large caps over multi-decade periods, though with significantly more volatility along the way. The Russell 2000 works best as a complement to large-cap exposure rather than a replacement for it.
What Could Derail the Small-Cap Rally
The same feature that powered the Russell 2000’s 22% first-half gain is its biggest vulnerability going into the second half of 2026.
If inflation re-accelerates and forces the Fed to pause or reverse its easing path, small-cap companies with floating-rate debt will feel it immediately. Bank of America’s strategists flagged this risk explicitly heading into the second half, noting that every additional 25 basis point hike reduces Russell 2000 operating earnings by approximately 2%. With roughly 30% probability of a rate hike priced in at the Fed’s July 28-29 meeting as of early July, that risk was not hypothetical.
Valuations are no longer as compelling as they were at the start of the year either. The Russell 2000’s forward price-to-earnings ratio reached 26.4x in late June according to Dow Jones Market Data, surpassing the S&P 500’s forward multiple. The valuation discount that attracted institutional rotation into small caps earlier in 2026 had largely closed by midyear.
Seasonal patterns also work against the index following reconstitution. Julian Emanuel, chief equity and quantitative strategist at Evercore, noted that small caps historically give back a portion of their outperformance in the weeks following the annual Russell rebalance. July has historically been the Russell 2000’s eighth-best performing month, with average gains of just 0.6%.
None of this makes the small-cap thesis structurally broken. It makes the second half of 2026 more selective than the first.
Conclusion
The Russell 2000 gained 22% in the first half of 2026 and hit an all-time high. It outperformed every major US index over that period. For investors who spent years watching mega-cap technology dominate every return table, that reversal was significant.
What it reflects is a market broadening. Capital rotating out of crowded, expensive large-cap positions into domestically focused businesses with room to re-rate. Rate relief filtering through small-cap balance sheets. Earnings growth broadening beyond the Magnificent Seven into sectors that form the backbone of the US economy.
The Russell 2000 is not a simple index to follow. Its 2,000 components span every sector, include a significant proportion of unprofitable companies, and respond to Fed policy more quickly and more forcefully than any other major benchmark. Understanding those characteristics is what separates investors who build conviction around the Russell 2000 from those who react to its movements without knowing what is actually driving them.
Frequently Asked Questions
What is FintechZoom.com Russell 2000?
FintechZoom.com Russell 2000 refers to the platform’s real-time coverage of the small-cap index, providing live tracking, sector data, technical analysis tools, and market news for investors monitoring US small-cap stocks and broader market conditions.
How is the Russell 2000 different from the S&P 500?
The Russell 2000 tracks 2,000 small-cap US companies weighted by float-adjusted market capitalization. The S&P 500 tracks 500 large-cap companies. Small caps are predominantly domestic in revenue, more sensitive to interest rates, and include a significantly higher proportion of unprofitable companies. The two indices measure different segments of the economy and regularly diverge in performance.
How often does the Russell 2000 reconstitute?
Starting in 2026, the Russell 2000 reconstitutes twice per year, in June and December. Before 2026, reconstitution occurred annually each June. The change was made to keep index membership more current as market capitalizations shift throughout the year.
What moves the Russell 2000 the most?
Federal Reserve policy and interest rate expectations are the single biggest driver, given that roughly 40% of Russell 2000 companies carry floating-rate debt. Domestic economic data, earnings growth across small-cap sectors, and capital rotation between large-cap and small-cap segments are the other primary forces.
What ETFs track the Russell 2000?
IWM, the iShares Russell 2000 ETF, is the most liquid option and the standard for active traders. VTWO, the Vanguard Russell 2000 ETF, carries a lower expense ratio and suits long-term passive investors better. Both track the full Russell 2000 index directly.